Top 10 Highest CSR2 County Averages In Iowa
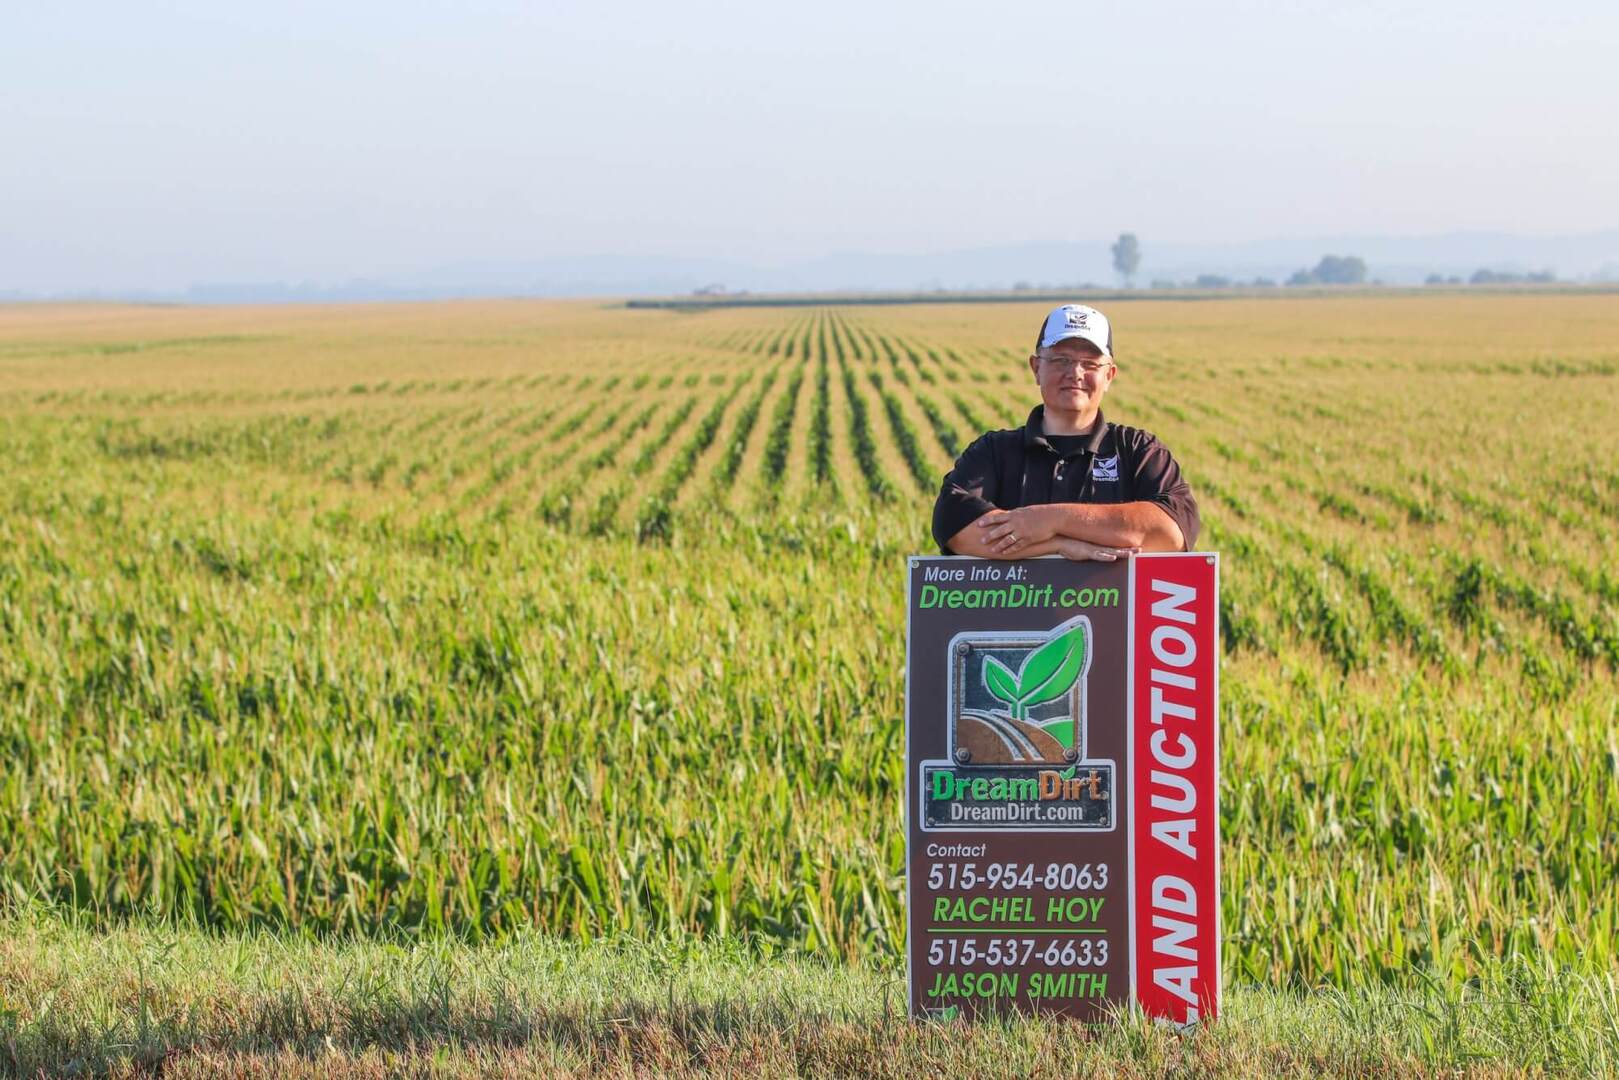
Jason J Smith
Auctioneer & Land Broker
Jason is an experienced farmland broker and auctioneer with extensive experience in farmland sales across this Midwest. Jason has worked with hundreds of clients to create advantageous outcomes. If you are selling land schedule a consultation with Jason by calling or using the calendar.
Phone: 515-537-6633
The Corn Suitability Rating or CSR has been around since 1971 when it was first described in an ISU publication by Dr. Thomas Fenton a professor of agronomy at Iowa State University but the concept of CSR and productivity ratings date clear back to 1930 when the concept was first noted at ISU. In 2011 ISU began rolling out the next version of CSR known as CSR2 which fixed in inconsistency that was a part of CSR. While it was difficult for many to grasp it took advantage of 30 years of additional data and production records and removed the weather factor from CSR to CSR2.
CSR is a measure of inherent soil properties to a deputy of 60 to 80 inches and i is calculated as CSR2 = S-M-W-F-D ± EJ
S – is the taxonomic subgroup class of the series of the soil map unit (MU),
M – is the family particle size class,
W – relates to available water holding capacity of the series
F – is the field condition of a particular MU, for example, slope, flooding, ponding, erosion class and topsoil thickness,
D – is the soil depth and tolerable rate of soil erosion,
EJ – is an expert judgment correction factor. EJ is normally used with parent materials that have very high bulk density and/or are unusually clayey or sandy.
What seems like a complex system is really not that complex. Each of the elements considered is assigned fixed values and it becomes a matter of simple math to calculate the CSR of a given soil. Most experienced land salesmen can calculate the particular CSR2 of a soil with just a little research.
You may have noticed when we sell a farm it has a CSR2 and its honestly not often referred to as the Average Weighted CSR2 of a farm because almost all farms are made up up at least 2 go 3 soil types and some can have many more soil types. If each soil has its own CSR2 and a farm has multiple soil types its necessary to average the weight of each soil based on its percentage of the farm.
Below is the chart from a small 40 acre farm I have for sale right now in Guthrie County. You can see that there are 8 soil types on the farm and that each of those soil types has its own CSR2 rating but when you combine them together on 1 farm you have to have a way to calculate the average CSR of the entire farm.
The lines on the map represent the border between soil types and each soil type on the map is given an identification number or code. Above you can see 370B represents Sharpsburg silty clay loam with 2 to 5 percent slopes. It makes up 11.9% of the 40 acres and it has a CSR2 of 90. Thats a very good soil but because it only makes up 11.9% of the farm it will only be responsible for 11.9% of the final weighted average. You’ll notice there is a 222D2 soil that has a CSR2 rating of 17 and it makes up .3% of the farm. Its a very small spot on the botton of the graphic left of center. This lower quality soil will only be responsible for .3% of the final weighted average. When all of the soils are averaged together for their representation of the total farm we can arrive at the final weighted average which is 70.4 for this particular piece of farmland. That is the figure you see us advertise when we sell farms is the weighted average of the farm.
So is it possible for a CSR2 to change from year to year? No its not, CSR2’s are fixed values that won’t change with fertilizer application or clearing trees or anything for that matter. In fact, CSR2 doesn’t even speak to a farms fertility like many think. What the CSR2 is is a measure of a farms ability to be intensely farmed over a long period of time. Should that make a difference in your purchase decisions about a farm? Can a 40 CSR farm produce the same as a 90 CSR farm? On an individual basis they sure can because all things are different including weather, farming methods, seed choice, crop management, temperatures, disease and pest exposure but as a rule and by the averages higher CSR farms will yield better crops.
WHAT ARE THE HIGHEST CSR COUNTY AVERAGES IN IOWA?
Here are the top 10 Iowa Counties by CSR rating ) (NOT CSR2)
- 10 Hamilton County 75.5
- 9 Marshall County 75.9
- 8 Hardin County 75.9
- 7 Greene County 76.4
- 6 Franklin County 76.8
- 5 Calhoun County 77.4
- 4 Cedar County 77.5
- 3 Story County 77.6
- 2 Mitchell County 77.7
- 1 Grundy County 84.7
The highest CSR average in the state of Iowa goes to Grundy County or what many refer to as “The Garden Spot of Iowa” While you can see that many of the top 10 counties are in the 75.5 to 77.7 range, its a very tight right with only .1 separating 4 of the counties but Grundy County, well ahead of the pack comes in at 84.7 CSR average.
With the changes in CSR to CSR2 we saw changes in the top ranking 10 Counties in Iowa. Notice in the new CSR2 map that was implemented in 2011 Obrien County takes over as the top spot in Iowa leaving Grundy County behind by 4.5 points. Grundy still comes in a respectable 2nd place at 86.9 and Osceola County close behind at 86.3. Then in line you have Buena Vista County at 83.4, Sac County at 82.8 Cherokee County at 82.2, Calhoun at 82.2, Pocahontas County at 81.2, Mitchell County at 80.9 and Humboldt at 80.3
Are you trying to learn the CSR2 of a farm you are selling? We are always looking for opportunities to meet and visit with people considering selling farms and help them evaluate the sale. We can provide you soil maps and CSR2 Ratings for your farm quickly. Drop me a line on the form to the left or below or send me an email [email protected]
Request a Free Valuation for Your Farm or Land Property
Whether you’re ready to start the selling process, or even remotely curious, we will gladly provide you with a FREE Market Analysis! If you are in a position to sell land in the Midwest, we want to help you achieve the top of the market on your sale.
Insights from the REALTORS® Land Institute: Understanding Iowa’s Farmland Market Trends
Iowa Land Price Trends At DreamDirt Auctions, we're committed to keeping our audience of landowners informed about the latest developments in the agricultural real estate market. Today, we're excited to share insights from the REALTORS® Land Institute - Iowa Chapter's...
Unlocking the Value of Nebraska Farmland: A Comprehensive Guide to Current Land Prices and Expert Insights – February 2024 Report
Welcome to Our Monthly Nebraska Farmland Value Report In this monthly report, Jason Smith, Nebraska Land Broker and Auctioneer dives into Nebraska farmland values, helping you understand the factors that determine what your farm is potentially worth. Our goal as...
Unlocking the Value of Minnesota Farmland: A Comprehensive Guide to Current Land Prices and Expert Insights – February 2024 Report
Welcome to Our Monthly Minnesota Farmland Value Report In this monthly report, Jason Smith, Land Broker and Auctioneer dives into Minnesota farmland values, helping you understand the factors that determine what your farm is potentially worth. Our goal as auctioneers...

