Iowa Farmland Prices September 2025: Auction Results & Market Trends
Welcome to Our Monthly Iowa Farmland Value Report
In this monthly report, we dive into Iowa farmland values, helping you understand the factors that determine what your farm is potentially worth. Our goal as auctioneers and farmland real estate agents is to provide you with up-to-date information, recent sales data, expert insights, and tips for maximizing the potential value of your farmland sale. Let us answer the questions you have about selling farmland in Iowa. Contact us today for a free consultation.

Iowa Farmland Market Update – September 2025
September saw 9,355 acres change hands sold by auction, with farmland averaging just under $11,700 per acre. When adjusted for tillable ground, values climbed above $12,300 per acre. Strong productivity (CSR2 ~73) supported per-CSR2 values of about $161, reflecting steady demand and competition for quality Iowa farmland.
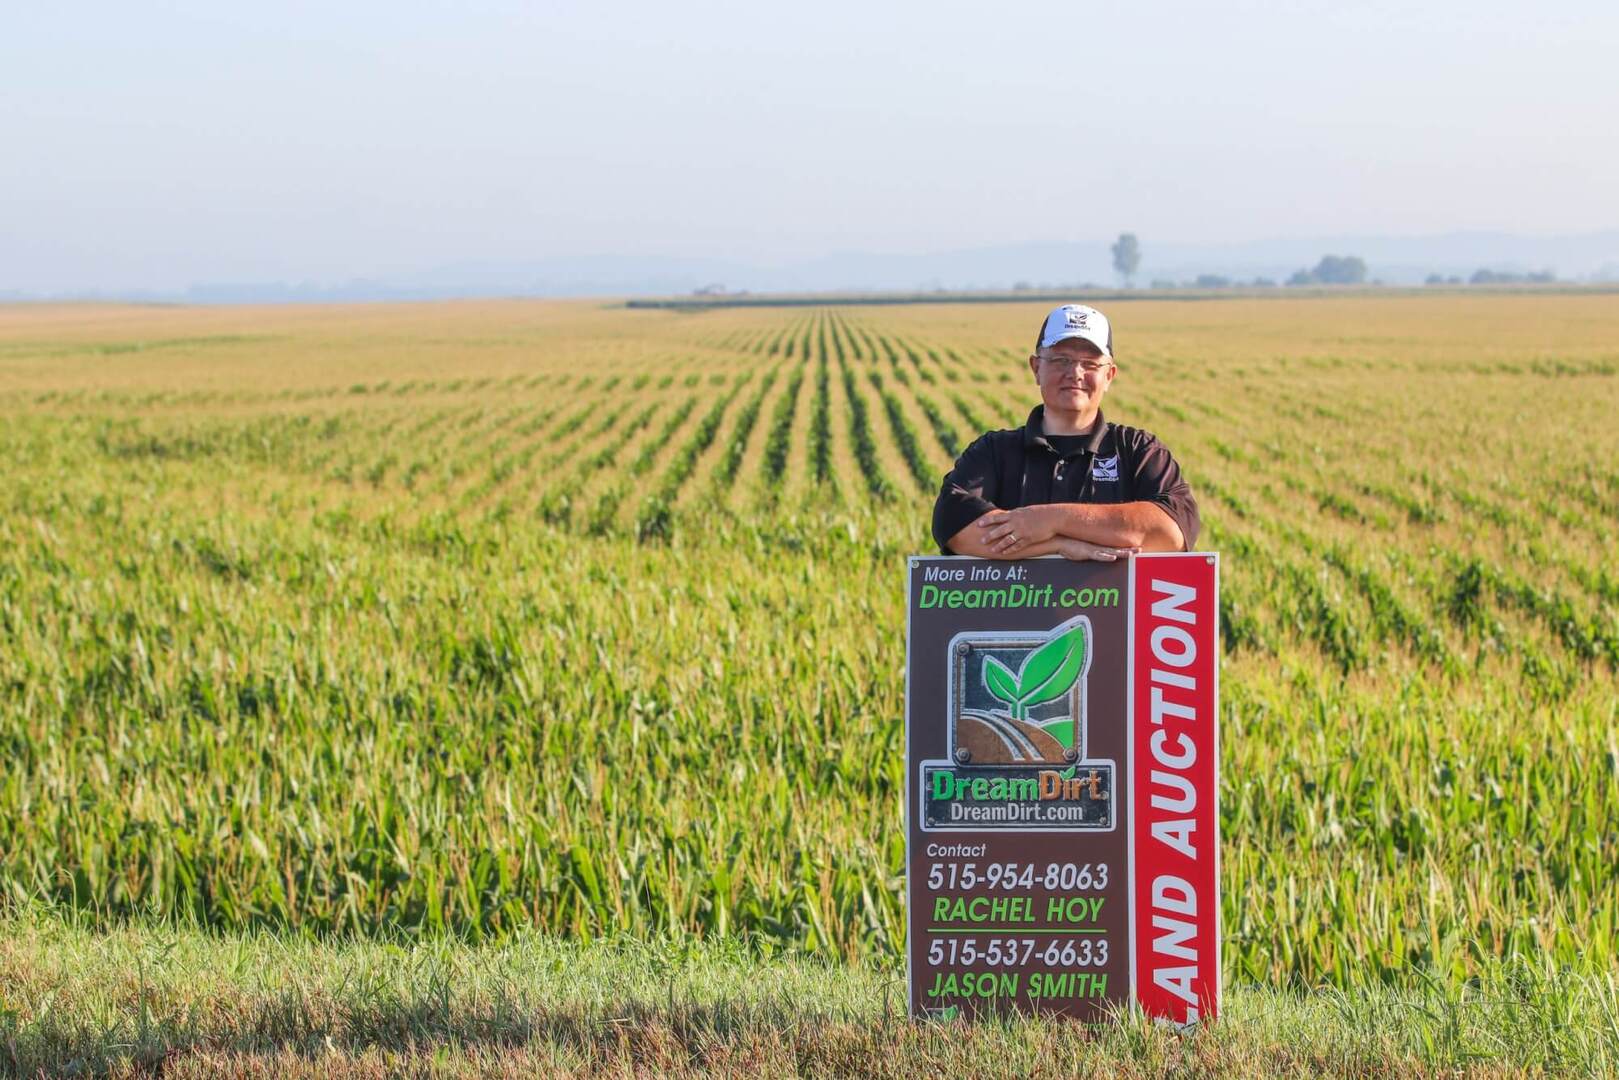
Jason J Smith
Auctioneer & Land Broker
Jason is an experienced farmland broker and auctioneer with extensive experience in farmland sales across this Midwest. Jason has worked with hundreds of clients to create advantageous outcomes. If you are selling land schedule a consultation with Jason by calling or using the calendar.
Phone: 515-537-6633 Email: Jason@dreamdirt.com
September 2025 Sales Snapshot (80% or more tillable farms)
Iowa farmland continued to show resilience in September 2025, with nearly 10,000 acres sold statewide across 98 transactions. The month’s sales totaled $114.9 million, signaling steady demand as farmers and investors remain active in the market despite interest rate pressures and harvest season timing.
Key Stats:
-
Total Acres Sold: 9,911 acres
-
Total Tillable Acres Sold: 9,355 acres
-
Total Sales Volume: $114,952,368
-
Average Price per Acre: $11,657
-
Average Price per Tillable Acre: $12,288
-
Average CSR2: 72.78
-
Average $/CSR2 Point: $161
-
Total Transactions: 98
Overall, the September market remained strong and stable compared to late summer trends, maintaining consistent averages across productivity levels and regions.
See full results from all tracts of farmland that sold in table at end of the page.

County Highlights
Several counties stood out in September:
Mitchell County – Highest sale of the month at $24,400/acre (80 acres, CSR2 81.2)
Dallas County – Reached $20,100/acre on a 137.9-acre tract (CSR2 87.7)
Cedar County – High-quality farmland sold for $19,000/acre (156.5 acres, CSR2 93.3)
Osceola County – Strong sale at $18,400/acre (71 acres, CSR2 96.7)
Plymouth County – Brought $18,000/acre on 160 acres (CSR2 87.1)
Counties with the most acres sold included Plymouth (585 acres), Monona (560 acres), Hancock (400 acres), and Cass (382 acres), representing a mix of strong northern and western Iowa activity.
Lower-end sales were concentrated in Hancock, Monona, and Adair Counties, where smaller tracts or mixed-use properties with lower CSR2 ratings sold between $4,400 and $5,700 per acre.

Month-to-Month Change (August → September 2025)
-
August 2025: 4,218 acres sold | $12,576/acre
- September 2025: 9,911 acres sold | $11,657/acre
Acres sold increased 135%
Prices per acre decreased -7.3%
This trend shows that while demand for farmland remained strong in September, buyers were able to purchase more acres at slightly lower per-acre prices.
Year-over-Year Change (September 2024 → September 2025)
-
September 2024: 7,891 acres sold | $11,930/acre
-
September 2025: 9,911 acres sold | $11,657/acre
Acres sold increased 25.6%
Prices declined 2.3% year-over-year
This combination of more acres selling at slightly lower per-acre values suggests continued buyer interest but at more moderated price levels than last year.
Auction Activity
In total, nearly $115 million in farmland value sold at auction in September.
-
Acres sold: 9,911 acres across all reported sales
-
Largest county by volume: Palo Alto, with 735 acres across 8 sales
-
Competitive counties: Butler, Poweshiek, and Kossuth also saw over 400 acres each sold at strong prices

Market Takeaways
The September 2025 Iowa farmland market demonstrated remarkable consistency. Premium-quality tracts with high CSR2 ratings continue to command top-dollar, while more marginal or mixed-use land is finding a stable footing in the $4,500–$6,000 range.
Overall, Iowa’s farmland market remains steady and competitive, with a healthy balance between local operators, investors, and expansion-minded farmers.

Acres Sold at Auction
Auction activity increased again in September 2025, with over 9,911 acres changing hands statewide, which is double August’s total. Compared to last September, acres sold increased by 25.6%, signaling that there is still demand for good tillable farmland in Iowa when owners decide to sell and put on the market via the auction method.
If selling is on your mind, now is a great time to start the conversation. Our team is here to guide you through your options with expert support every step of the way. Just fill out this short form, and one of our experienced auctioneers or land brokers will be in touch soon!

About DreamDirt
DreamDirt specializes in Iowa farmland auctions and listings, offering trusted market data, expert land valuations, and proven marketing strategies to help sellers achieve the best outcomes.
For more farmland insights or to request a free farmland valuation.
Recently Sold Land in Iowa Price Results
| Date | County | Acres | $/Acre | Total $ | Tillable Acres | % Tillable | $/Tillable | CSR2 | $/CSR2 |
|---|---|---|---|---|---|---|---|---|---|
| 09/04/2024 | Emmet | 120 | $12,000 | $1,440,000 | 111.33 | 92.78 | $12,935 | 81 | $148 |
| 09/03/2025 | Dickinson | 153.72 | $12,200 | $1,875,384 | 147.94 | 96.24 | $12,677 | 86.1 | $142 |
| 09/03/2025 | O'Brien | 62.24 | $8,100 | $504,144 | 55.6 | 89.33 | $9,067 | 66.7 | $121 |
| 09/04/2025 | Hancock | 151.83 | $10,000 | $1,518,300 | 151.74 | 99.94 | $10,006 | 81.3 | $123 |
| 09/04/2025 | Cass | 190.76 | $13,000 | $2,479,880 | 166 | 87.02 | $14,939 | 82 | $159 |
| 09/04/2025 | Cedar | 156.5 | $19,000 | $2,973,500 | 152.3 | 97.32 | $19,524 | 93.3 | $204 |
| 09/05/2025 | Plymouth | 80 | $16,000 | $1,280,000 | 78.73 | 98.41 | $16,258 | 85.1 | $188 |
| 09/05/2025 | Tama | 11.46 | $6,500 | $74,490 | 11.06 | 96.51 | $6,735 | 57.4 | $113 |
| 09/05/2025 | Hardin | 155 | $13,100 | $2,030,500 | 152.38 | 98.31 | $13,325 | 85 | $154 |
| 09/08/2025 | Plymouth | 80 | $16,000 | $1,280,000 | 77.4 | 96.75 | $16,537 | 86.4 | $185 |
| 09/09/2025 | Emmet | 80 | $12,100 | $968,000 | 79.29 | 99.11 | $12,208 | 83.6 | $145 |
| 09/09/2025 | Emmet | 80 | $11,500 | $920,000 | 79.28 | 99.10 | $11,604 | 82.9 | $139 |
| 09/09/2025 | Emmet | 80 | $9,100 | $728,000 | 68.74 | 85.93 | $10,591 | 80.9 | $112 |
| 09/09/2025 | Emmet | 80 | $7,700 | $616,000 | 79 | 98.75 | $7,797 | 81 | $95 |
| 09/09/2025 | Franklin | 33 | $9,697 | $320,001 | 32.76 | 99.27 | $9,768 | 84.3 | $115 |
| 09/09/2025 | Osceola | 71 | $18,400 | $1,306,400 | 68.35 | 96.27 | $19,113 | 96.7 | $190 |
| 09/09/2025 | Story | 92.52 | $9,400 | $869,688 | 84.47 | 91.30 | $10,296 | 68.2 | $138 |
| 09/09/2025 | Lee | 78.8 | $12,675 | $998,790 | 71.44 | 90.66 | $13,981 | 66 | $192 |
| 09/09/2025 | Van Buren | 81.75 | $12,500 | $1,021,875 | 74 | 90.52 | $13,809 | 73.8 | $169 |
| 09/10/2025 | Hancock | 119 | $10,500 | $1,249,500 | 113.14 | 95.08 | $11,044 | 64.2 | $164 |
| 09/10/2025 | Hancock | 80 | $7,000 | $560,000 | 77.87 | 97.34 | $7,191 | 50.1 | $140 |
| 09/10/2025 | Hancock | 40 | $5,400 | $216,000 | 34.29 | 85.73 | $6,299 | 55.6 | $97 |
| 09/10/2025 | Hancock | 80 | $4,400 | $352,000 | 78.44 | 98.05 | $4,488 | 41 | $107 |
| 09/10/2025 | Dallas | 80 | $14,000 | $1,120,000 | 75.22 | 94.03 | $14,890 | 82.5 | $170 |
| 09/10/2025 | Dallas | 137.9 | $20,100 | $2,771,790 | 134.37 | 97.44 | $20,628 | 87.7 | $229 |
| 09/10/2025 | Mitchell | 80 | $24,400 | $1,952,000 | 77.82 | 97.28 | $25,084 | 81.2 | $300 |
| 09/10/25 | Plymouth | 160 | $18,000 | $2,880,000 | 150.61 | 94.13 | $19,122 | 87.1 | $207 |
| 09/11/2025 | Franklin | 155 | $12,700 | $1,968,500 | 148.92 | 96.08 | $13,219 | 86 | $148 |
| 09/11/2025 | Franklin | 146 | $10,300 | $1,503,800 | 138.58 | 94.92 | $10,851 | 85.1 | $121 |
| 09/11/2025 | Franklin | 88 | $12,500 | $1,100,000 | 85 | 96.59 | $12,941 | 89.5 | $140 |
| 09/11/2025 | Wright | 50.83 | $5,700 | $289,731 | 41 | 80.66 | $7,067 | 58.3 | $98 |
| 09/12/2025 | Calhoun | 69 | $10,400 | $717,600 | 69 | 100.00 | $10,400 | 85.5 | $122 |
| 09/16/2025 | Lee | 107.46 | $14,200 | $1,525,932 | 102 | 94.92 | $14,960 | 56 | $254 |
| 09/16/2025 | Lee | 88.91 | $9,050 | $804,636 | 86 | 96.73 | $9,356 | 40.5 | $223 |
| 09/16/2025 | Lee | 59.84 | $9,100 | $544,544 | 55 | 91.91 | $9,901 | 42.5 | $214 |
| 09/16/2025 | Keokuk | 61.7 | $13,500 | $832,950 | 60.54 | 98.12 | $13,759 | 78.5 | $172 |
| 09/16/2025 | Jefferson | 139.2 | $11,400 | $1,586,880 | 130.69 | 93.89 | $12,142 | 70.2 | $162 |
| 09/16/2025 | Hancock | 160 | $12,500 | $2,000,000 | 147.2 | 92.00 | $13,587 | 82.2 | $152 |
| 09/16/2025 | Winneshiek | 62 | $10,500 | $651,000 | 61 | 98.39 | $10,672 | 52.3 | $201 |
| 09/16/2025 | Winneshiek | 81.5 | $10,000 | $815,000 | 73 | 89.57 | $11,164 | 46.6 | $215 |
| 09/17/2025 | Plymouth | 104.36 | $10,000 | $1,043,600 | 102.99 | 98.69 | $10,133 | 80.4 | $124 |
| 09/17/2025 | Plymouth | 154 | $9,900 | $1,524,600 | 150.13 | 97.49 | $10,155 | 54.5 | $182 |
| 09/17/2025 | Plymouth | 79.68 | $10,900 | $868,512 | 75.12 | 94.28 | $11,562 | 66.3 | $164 |
| 09/17/2025 | Plymouth | 79 | $10,900 | $861,100 | 78.73 | 99.66 | $10,937 | 54.6 | $200 |
| 09/17/2025 | Franklin | 105 | $11,700 | $1,228,500 | 96.72 | 92.11 | $12,702 | 82.9 | $141 |
| 09/17/2025 | Plymouth | 207.33 | $16,600 | $3,441,678 | 207.33 | 100.00 | $16,600 | 83.5 | $199 |
| 09/17/2025 | Plymouth | 195 | $8,500 | $1,657,500 | 188.77 | 96.81 | $8,781 | 58.2 | $146 |
| 09/18/2025 | Plymouth | 77.59 | $14,750 | $1,144,453 | 77.59 | 100.00 | $14,750 | 75.2 | $196 |
| 09/18/2025 | Plymouth | 62.47 | $10,700 | $668,429 | 53.83 | 86.17 | $12,417 | 31.3 | $342 |
| 09/18/2025 | Plymouth | 26.81 | $15,200 | $407,512 | 26.82 | 100.04 | $15,194 | 70 | $217 |
| 09/18/2025 | Plymouth | 78 | $7,200 | $561,600 | 67.75 | 86.86 | $8,289 | 48 | $150 |
| 09/18/2025 | Audubon | 79 | $7,100 | $560,900 | 75 | 94.94 | $7,479 | 56.9 | $125 |
| 09/18/2025 | Clinton | 84.21 | $16,700 | $1,406,307 | 82.69 | 98.19 | $17,007 | 90.1 | $185 |
| 09/18/2025 | Tama | 155.38 | $12,600 | $1,957,788 | 149.56 | 96.25 | $13,090 | 88.1 | $143 |
| 09/19/2025 | Cherokee | 74.73 | $12,500 | $934,125 | 70.42 | 94.23 | $13,265 | 84.2 | $148 |
| 09/19/2025 | Cherokee | 118 | $17,000 | $2,006,000 | 116.13 | 98.42 | $17,274 | 86.5 | $197 |
| 09/19/2025 | Cherokee | 160 | $17,000 | $2,720,000 | 153.54 | 95.96 | $17,715 | 85.6 | $199 |
| 09/19/2025 | Grundy | 117 | $16,900 | $1,977,300 | 117 | 100.00 | $16,900 | 89.4 | $189 |
| 09/19/2025 | Grundy | 40 | $13,400 | $536,000 | 38 | 95.00 | $14,105 | 92 | $146 |
| 09/19/2025 | Grundy | 38 | $10,000 | $380,000 | 36 | 94.74 | $10,556 | 86.3 | $116 |
| 09/19/2025 | Hardin | 160 | $6,000 | $960,000 | 158.03 | 98.77 | $6,075 | 70.5 | $85 |
| 09/23/2025 | Des Moines | 76 | $10,025 | $761,900 | 66.79 | 87.88 | $11,407 | 80.2 | $125 |
| 09/24/2025 | Monona | 214.7 | $6,300 | $1,352,610 | 204.16 | 95.09 | $6,625 | 54.5 | $116 |
| 09/24/2025 | Monona | 252.36 | $6,100 | $1,539,396 | 247.68 | 98.15 | $6,215 | 52 | $117 |
| 09/24/2025 | Audubon | 77.45 | $15,132 | $1,171,973 | 73.07 | 94.34 | $16,039 | 74.5 | $203 |
| 09/24/2025 | Mitchell | 116.51 | $16,600 | $1,934,066 | 112.27 | 96.36 | $17,227 | 83.5 | $199 |
| 09/25/2025 | Greene | 153.11 | $11,200 | $1,714,832 | 147.94 | 96.62 | $11,591 | 77.4 | $145 |
| 09/25/2025 | Greene | 80 | $10,300 | $824,000 | 77.03 | 96.29 | $10,697 | 73.6 | $140 |
| 09/25/2025 | Greene | 80 | $12,600 | $1,008,000 | 75.4 | 94.25 | $13,369 | 78 | $162 |
| 09/25/2025 | Greene | 6.5 | $11,538 | $74,997 | 6.5 | 100.00 | $11,538 | 89.9 | $128 |
| 09/25/2025 | Poweshiek | 120 | $10,800 | $1,296,000 | 107.68 | 89.73 | $12,036 | 57.5 | $188 |
| 09/25/2025 | Poweshiek | 129 | $12,800 | $1,651,200 | 118.5 | 91.86 | $13,934 | 86.1 | $149 |
| 09/25/2025 | Poweshiek | 80 | $13,800 | $1,104,000 | 78.44 | 98.05 | $14,074 | 86.1 | $160 |
| 09/25/2025 | Adair | 81.23 | $11,200 | $909,776 | 77.12 | 94.94 | $11,797 | 58.9 | $190 |
| 09/25/2025 | Union | 79 | $9,400 | $742,600 | 69.14 | 87.52 | $10,741 | 65.1 | $144 |
| 09/25/2025 | Union | 39 | $10,600 | $413,400 | 35 | 89.74 | $11,811 | 74.5 | $142 |
| 09/25/2025 | Adair | 232 | $7,200 | $1,670,400 | 193.12 | 83.24 | $8,650 | 51.6 | $140 |
| 09/25/2025 | Adair | 158.86 | $5,500 | $873,730 | 138.37 | 87.10 | $6,314 | 46.9 | $117 |
| 09/25/2025 | Cherokee | 206.59 | $11,800 | $2,437,762 | 177.29 | 85.82 | $13,750 | 87.1 | $135 |
| 09/25/2025 | Cherokee | 109.38 | $10,200 | $1,115,676 | 91.42 | 83.58 | $12,204 | 86.5 | $118 |
| 09/25/2025 | Wright | 76.63 | $15,100 | $1,157,113 | 76.63 | 100.00 | $15,100 | 87.4 | $173 |
| 09/25/2025 | Wright | 40 | $12,700 | $508,000 | 40 | 100.00 | $12,700 | 81 | $157 |
| 09/25/2025 | Audubon | 75 | $8,000 | $600,000 | 68.21 | 90.95 | $8,796 | 60.4 | $132 |
| 09/25/2025 | Adair | 114.5 | $10,400 | $1,190,800 | 112.56 | 98.31 | $10,579 | 72.2 | $144 |
| 09/25/2025 | Adair | 64.19 | $7,600 | $487,844 | 63.26 | 98.55 | $7,712 | 58.8 | $129 |
| 09/25/2025 | Adair | 156 | $10,400 | $1,622,400 | 148.37 | 95.11 | $10,935 | 64.2 | $162 |
| 09/25/2025 | Greene | 50.31 | $15,500 | $779,805 | 46.98 | 93.38 | $16,599 | 87.7 | $177 |
| 09/25/2025 | Greene | 117.6 | $12,800 | $1,505,280 | 110.8 | 94.22 | $13,586 | 83 | $154 |
| 09/25/2025 | Greene | 160 | $12,900 | $2,064,000 | 156.3 | 97.69 | $13,205 | 69.5 | $186 |
| 09/26/2025 | Washington | 124.5 | $11,000 | $1,369,500 | 104.8 | 84.18 | $13,068 | 69.3 | $159 |
| 09/26/2025 | Washington | 85 | $13,500 | $1,147,500 | 84 | 98.82 | $13,661 | 69 | $196 |
| 09/26/2025 | Washington | 62 | $6,500 | $403,000 | 53 | 85.48 | $7,604 | 40.4 | $161 |
| 09/26/2025 | Johnson | 60 | $13,000 | $780,000 | 49.79 | 82.98 | $15,666 | 67.1 | $194 |
| 09/26/2025 | Monona | 186.92 | $4,900 | $915,908 | 182.57 | 97.67 | $5,017 | 59.1 | $83 |
| 09/30/2025 | Sac | 72.63 | $15,000 | $1,089,450 | 68.51 | 94.33 | $15,902 | 87.5 | $171 |
| 09/30/2025 | Calhoun | 20.62 | $15,600 | $321,672 | 19.48 | 94.47 | $16,513 | 86.5 | $180 |
| 09/30/2025 | Poweshiek | 73.1 | $12,600 | $921,060 | 69.17 | 94.62 | $13,316 | 73.8 | $171 |
| Totals/Averages | $9,911 | $11,657 | $114,952,368 | 9355 | 94.39 | $12,288 | 72.78 | $161 |
Navigating the Selling Process:
Tips for Selling Your Farm in Iowa
Explore a set of practical tips for successfully selling your farmland by downloading our free eBooks here. Schedule a non obligatory consultation with us today and we will cover everything from when is the best time to sell, a customized marketing plan, sales methods, how we can help you find the right buyer, and answer your questions.
Farm Real Estate Experts in Iowa
Meet our team of Iowa farm real estate and auction experts who can provide you with valuable guidance and personalized assistance throughout the selling process. If you’re looking to uncover the true value of your Iowa farm or are considering selling, don’t hesitate to reach out to our experienced team. We’re here to provide you with a customized plan to meet your goals. Contact us today to get started.
Assessing Your Farm’s Worth:
Iowa Land Market Analysis Appraisal Technique
Curious what your farm could sell for? We prepare market analysis for each of our farmland sellers to help you discover and learn what your farm is worth from our market based research and expertise. Fill out our form here to request a market analysis of your Iowa farmland.