Unlocking the Value of Iowa Farmland: A Comprehensive Guide to Current Land Prices and Expert Insights - February 2024 Report
Welcome to Our Monthly Iowa Farmland Value Report
In this monthly report, we dive into Iowa farmland values, helping you understand the factors that determine what your farm is potentially worth. Our goal as auctioneers and farmland real estate agents is to provide you with up-to-date information, recent sales data, expert insights, and tips for maximizing the potential value of your farmland sale. Let us answer the questions you have about selling farmland in Iowa. Contact us today for a free consultation.
Understanding Iowa Farmland Values:
Factors Influencing Farmland Values in Iowa
Iowa’s agricultural landscape is influenced by a multitude of factors. In this blog, we will explore how commodity prices, interest rates, government policies, and regional conditions impact the current market values.
With falling commodity prices and tighter margins anticipated in 2024, farmers are bracing for a significant decrease in net farm income, exacerbated by stagnant interest rates. Operating costs are expected to remain elevated due to these conditions. Economists predict several potential consequences, including a slowdown in equipment sales, moderation of land values and rental rates, consolidation among farm service businesses, and adverse effects on financial ratios.
Given that this is an election year, certain economists speculate that a decline in net farm income might be alleviated by Congressional intervention. According to one economist from the Ag Economists’ Monthly Monitor, heightened Congressional activity during an election cycle could result in increased financial support for farmers. Additionally, some economists believe that the resilience of the U.S. balance sheet will also provide a buffer against the anticipated downturn.
Recent Farmland Sales Data
Let’s dive into the latest sales data, including county location, land size by acre amount, soil productivity ratings, and sale prices per acre and total price in the table below. By analyzing this data, you can get a clearer picture of how your property may be valued in the current market.
Current Average Price Per Acre of Farmland in Iowa
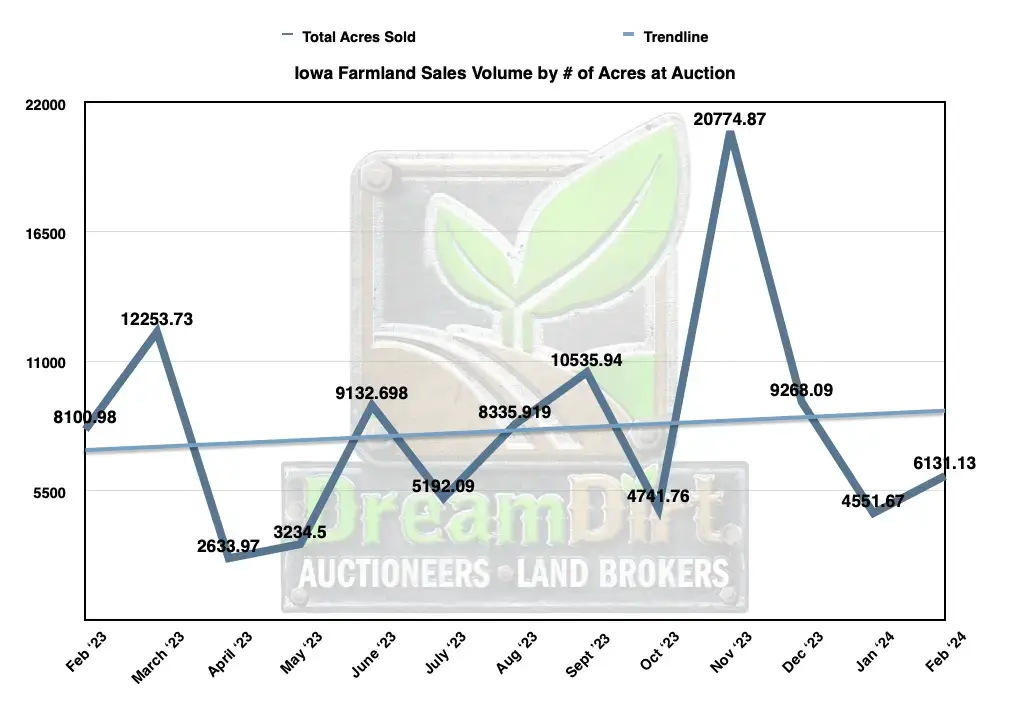
- In the month of February, a total of 6131.13 acres of land was sold in Iowa by auction
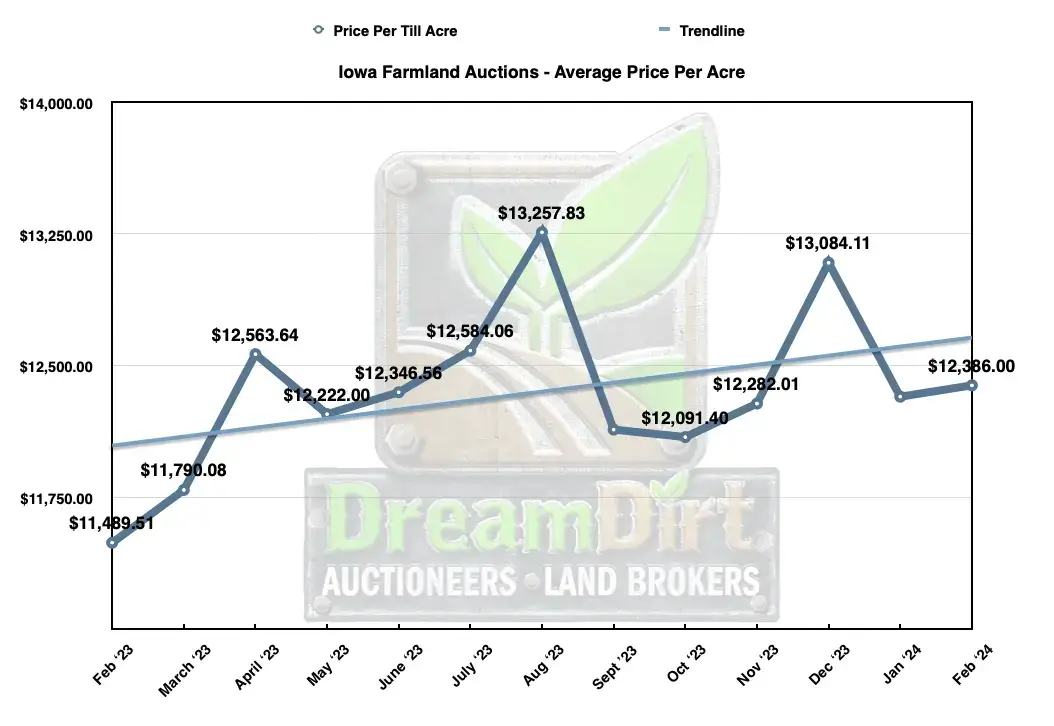
- The current average per acre price for land in Iowa according to February Auction sales is $12,386 per acre
- The highest selling farm in Iowa in the month of February sold on the 1st in Boone County for $16,800 per acre.
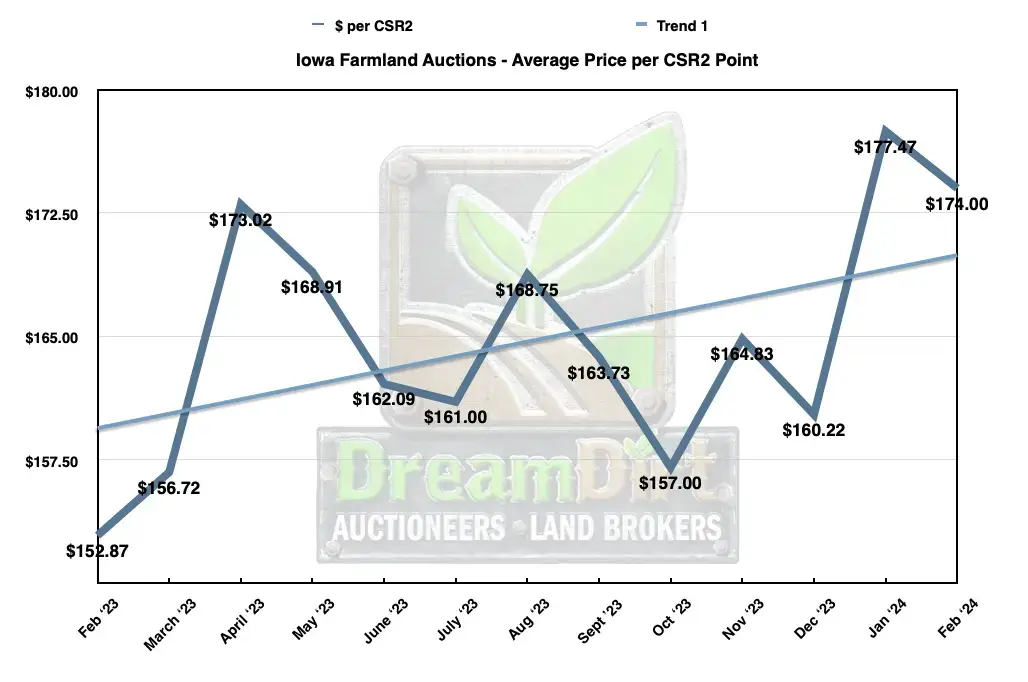
- This farm was sold by the auction method and was 229.21 acres of farmland which has a soil score rating of 86 CSR2 calculating to be $195/CSR point on a 99.9% tillable farm in Northwest Iowa.
- See full results from all 67 tracts of farmland that sold in table at end of the page.
- See how these averages compared to January and a year ago below in next section below to see trend line history.
Jason J Smith
Auctioneer & Land Broker
Jason is an experienced farmland broker and auctioneer with extensive experience in farmland sales across this Midwest. Jason has worked with hundreds of clients to create advantageous outcomes. If you are selling land schedule a consultation with Jason by calling or using the calendar.
Phone: 515-537-6633
Market Trends and Future Projections:
Each month we like discuss current trends in Iowa farmland sales, highlighting patterns, emerging opportunities, and potential challenges.
The monthly Rural Mainstreet Report provides a thorough analysis of the overall farm economy. In the February report, the following summary was highlighted.
- The Rural Mainstreet Index has remained below growth neutral for the sixth consecutive month.
- A significant portion, nearly three-fourths, of bank CEOs identified low farm commodity prices as the primary risk for farms in 2024.
- More than 40% of bankers highlighted declining farm commodity prices as the major risk for community banks in 2024.
- Around 44% of bankers observed a deterioration in the financial positions of farmers in their respective areas over the past six months.
- Farmland prices have continued to rise for the 51st consecutive month.
- The farm equipment sales index experienced a decline below growth neutral for the eighth time in the last nine months.
The Rural Mainstreet Report conducts a state-by-state analysis, and its findings for Iowa in February are noteworthy. In February, the Rural Mainstreet Index (RMI) for the state dropped to 38.8, down from January’s 44.3. Iowa’s farmland price index also decreased to 54.4 in February compared to January’s 61.4. However, Iowa’s new hiring index saw a slight increase to 45.7 from 45.1 in January. According to trade data provided by the International Trade Association, exports of agricultural goods and livestock in 2023 amounted to $1.5 billion, marking a notable decrease of 26.5% from the $2.1 billion reported in 2022.
Current Farmland Prices in Iowa: A 12-Month Overview
February Iowa Auction Results: Average Price Per CSR2 Point
February Iowa Auction Results: Increase in Acres Sold
Future Predictions for Farmland Values
Here you will gain insights into the future of Iowa’s farmland market with our expert forecasts. Understand what to expect in the coming months and years.
The land market in Iowa has maintained its stability throughout the winter, and we anticipate this stability to persist through 2024, barring any significant changes. Persistent challenges such as higher interest rates, lower commodity prices, and drought conditions persist, posing ongoing challenges for market participants.
Core inflation has decreased from a high of 5.6% in March 2022 to 3.8% in February 2024. Analysts generally predict a decline in interest rates in 2024, which is expected to benefit farmland sellers. Interestingly, drought and disaster events have a lesser impact on the market and can even bolster it through crop insurance payments.
As mentioned in previous blogs, a recurring pattern indicates that land prices often rise after a prolonged decline in commodity prices. While current prices are not as low as they were in May 2020, with prices hovering around $3.18, subsequent years saw significant increases. For instance, in 2021, prices rose to $7.34, and by the following spring in 2022, they reached a peak of $8.13, leading to a surge in land prices. As of now, prices stand around $4.29, leaning towards the lower end of the spectrum. Therefore, there is hope for an upward trend in the market. For our free e-book or to set up a consultation, contact our team by filling out the form below.
Navigating the Selling Process:
Tips for Selling Your Farm in Iowa
Explore a set of practical tips for successfully selling your farmland by downloading our free eBooks here. Schedule a non obligatory consultation with us today and we will cover everything from when is the best time to sell, a customized marketing plan, sales methods, how we can help you find the right buyer, and answer your questions.
Farm Real Estate Experts in Iowa
Meet our team of Iowa farm real estate and auction experts who can provide you with valuable guidance and personalized assistance throughout the selling process. If you’re looking to uncover the true value of your Iowa farm or are considering selling, don’t hesitate to reach out to our experienced team. We’re here to provide you with a customized plan to meet your goals. Contact us today to get started.
Assessing Your Farm’s Worth:
Iowa Land Market Analysis Appraisal Technique
Curious what your farm could sell for? We prepare market analysis for each of our farmland sellers to help you discover and learn what your farm is worth from our market based research and expertise. Fill out our form here to request a market analysis of your Iowa farmland.
Recently Sold Land in Iowa Price Results
| COUNTY | TOTAL ACRES | $ / ACRE | TILLABLE ACRES | CSR2 | $ / TILLABLE CSR2 | TOTAL PRICE | DATE |
|---|---|---|---|---|---|---|---|
| Boone | 229.21 | $16,800 | 229.2 | 86 | $195 | $3,850,728 | 2/1/24 |
| Humboldt | 75.44 | $8,800 | 66.72 | 82.6 | $120 | $663,872 | 2/2/24 |
| Monona | 73.08 | $8,450 | 68 | 50.7 | $179 | $617,526 | 2/3/24 |
| Lyon | 114.12 | $17,200 | 108.43 | 71.9 | $252 | $1,962,864 | 2/6/24 |
| Lyon | 79.12 | $19,500 | 78 | 73.9 | $268 | $1,542,840 | 2/6/24 |
| Lyon | 79.08 | $16,250 | 76.56 | 67.6 | $248 | $1,285,050 | 2/6/24 |
| Lyon | 44.76 | $19,000 | 38.55 | 73.8 | $299 | $850,440 | 2/6/24 |
| Jefferson | 42 | $6,900 | 23.55 | 72.4 | $170 | $289,800 | 2/6/24 |
| Des Moines | 69.83 | $14,150 | 69 | 80.7 | $177 | $988,095 | 2/7/24 |
| Grundy | 97.29 | $16,400 | 94.02 | 87.7 | $194 | $1,595,556 | 2/8/24 |
| Monona | 79.86 | $10,018 | 79.86 | 84.47 | $119 | $800,037 | 2/10/24 |
| Shelby | 160 | $14,100 | 150.23 | 80.8 | $186 | $2,256,000 | 2/12/24 |
| Shelby | 79 | $12,700 | 67.64 | 72.1 | $206 | $1,003,300 | 2/12/24 |
| Jackson | 110.38 | $8,100 | 95.6 | 43.5 | $215 | $894,078 | 2/13/24 |
| O'Brien | 112.4 | $19,500 | 112.07 | 96 | $204 | $2,191,800 | 2/14/24 |
| Grundy | 120 | $12,700 | 92.78 | 89.4 | - | $1,524,000 | 2/14/24 |
| Franklin | 76.79 | $15,200 | 76.02 | 86.7 | $177 | $1,167,208 | 2/14/24 |
| Grundy | 73.5 | $14,800 | 70.02 | 87.3 | $178 | $1,087,800 | 2/14/24 |
| Buchanan | 80 | $14,400 | 75.52 | 84.3 | $181 | $1,152,000 | 2/15/24 |
| Buchanan | 80 | $14,250 | 75.9 | 86.9 | $173 | $1,140,000 | 2/15/24 |
| Warren | 105.8 | $12,000 | 84.93 | 67.8 | $220 | $1,269,600 | 2/16/24 |
| Warren | 61.48 | $12,500 | 56.62 | 72.1 | $188 | $768,500 | 2/16/24 |
| Warren | 79.93 | $7,200 | 48.19 | 79.3 | - | $575,496 | 2/16/24 |
| Warren | 55.92 | $9,300 | 42.8 | 77 | - | $520,056 | 2/16/24 |
| Warren | 16.47 | $5,700 | 13.03 | 73.1 | - | $93,879 | 2/16/24 |
| Warren | 6.6 | $8,900 | 6.6 | 67 | $133 | $58,740 | 2/16/24 |
| Crawford | 69.61 | $11,050 | 64.47 | 79.4 | $150 | $769,191 | 2/17/24 |
| Crawford | 81.596 | $6,100 | 27.42 | 66.5 | - | $497,736 | 2/17/24 |
| Dallas | 200.36 | $17,400 | 198.35 | 88.7 | $198 | $3,486,264 | 2/20/24 |
| Keokuk | 181.88 | $5,900 | 171.49 | 56.5 | $111 | $1,073,092 | 2/20/24 |
| Keokuk | 38 | $6,250 | 35.89 | 50.6 | $132 | $237,500 | 2/20/24 |
| Wright | 116 | $14,000 | 109 | 81.3 | $183 | $1,624,000 | 2/21/24 |
| Henry | 120 | $12,583 | 118.46 | 81.7 | $156 | $1,509,960 | 2/22/24 |
| Webster | 120 | $12,500 | 113.35 | 76.2 | $174 | $1,500,000 | 2/22/24 |
| Marion | 203.29 | $7,300 | 152.68 | 82.4 | - | $1,484,017 | 2/22/24 |
| Henry | 80 | $16,063 | 80.71 | 86.4 | $184 | $1,285,040 | 2/22/24 |
| Webster | 102 | $12,100 | 98.56 | 84.6 | $148 | $1,234,200 | 2/22/24 |
| Cherokee | 79.39 | $13,000 | 76.29 | 92.9 | $146 | $1,032,070 | 2/22/24 |
| Butler | 112.17 | $9,100 | 109.45 | 77.7 | $120 | $1,020,747 | 2/22/24 |
| Webster | 80 | $12,200 | 77.52 | 71.5 | $176 | $976,000 | 2/22/24 |
| Webster | 80 | $12,100 | 78.5 | 74 | $167 | $968,000 | 2/22/24 |
| Webster | 74 | $12,300 | 71.75 | 74.7 | $170 | $910,200 | 2/22/24 |
| Marion | 128.82 | $6,300 | 108.18 | 75.3 | $100 | $811,566 | 2/22/24 |
| Webster | 57 | $14,000 | 56.54 | 86.8 | $163 | $798,000 | 2/22/24 |
| Greene | 80 | $9,700 | 77.74 | 74.6 | $134 | $776,000 | 2/22/24 |
| Marion | 78.25 | $9,100 | 76.19 | 80.7 | $116 | $712,075 | 2/22/24 |
| Webster | 40 | $13,900 | 39.68 | 65.9 | $213 | $556,000 | 2/22/24 |
| Butler | 23.83 | $8,250 | 23.1 | 60.6 | $140 | $196,598 | 2/22/24 |
| Butler | 37.24 | $2,925 | 33.65 | 63.1 | $51 | $108,927 | 2/22/24 |
| Sioux | 80 | $20,300 | 77.62 | 98.8 | $212 | $1,624,000 | 2/23/24 |
| Audubon | 80 | $15,000 | 76.16 | 75.3 | $209 | $1,200,000 | 2/23/24 |
| Audubon | 80 | $14,900 | 78.89 | 80.6 | $187 | $1,192,000 | 2/23/24 |
| Ringgold | 82.43 | $7,400 | 81.56 | 52 | $144 | $609,982 | 2/23/24 |
| Harrison | 112.68 | $9,000 | 77.27 | 62.5 | - | $1,014,120 | 2/26/24 |
| Chickasaw | 36.06 | $8,000 | 35.43 | 78 | $104 | $288,480 | 2/26/24 |
| Sioux | 117.41 | $29,600 | 115.94 | 99.7 | $301 | $3,475,336 | 2/27/24 |
| O'Brien | 149.24 | $12,300 | 141.31 | 92.6 | $140 | $1,835,652 | 2/27/24 |
| Buena Vista | 147 | $10,775 | 142.3 | 83.7 | $133 | $1,583,925 | 2/27/24 |
| O'Brien | 93.14 | $16,400 | 89.36 | 95.7 | $179 | $1,527,496 | 2/27/24 |
| Buena Vista | 80 | $13,850 | 78.4 | 86.5 | $163 | $1,108,000 | 2/27/24 |
| Buena Vista | 75 | $13,600 | 73.5 | 87.8 | $158 | $1,020,000 | 2/27/24 |
| Howard | 196.38 | $14,050 | 189.6 | 83.7 | $174 | $2,759,139 | 2/28/24 |
| Dickinson | 160 | $14,600 | 154.45 | 87.6 | $173 | $2,336,000 | 2/28/24 |
| Dallas | 68 | $13,300 | 67.93 | 87.7 | $152 | $904,400 | 2/28/24 |
| Bremer | 87.7 | $4,276 | 13.56 | - | - | $375,005 | 2/28/24 |
| Warren | 20 | $14,100 | 17.4 | 82.2 | $197 | $282,000 | 2/28/24 |
| Sioux | 80.59 | $19,500 | 77.16 | 83.6 | $244 | $1,571,505 | 2/29/24 |
| STATEWIDE AVERAGES | 91.51 | $12,386 | 83.38 | 77.96 | $174 | $1,170,500 | |
| STATEWIDE TOTALS | 6131.13 | 5586.65 | $78,423,487 |
