Iowa Farmland Prices for September 2023 Recent Sales Data
Current Average Price Per Acre for Farmland in Iowa
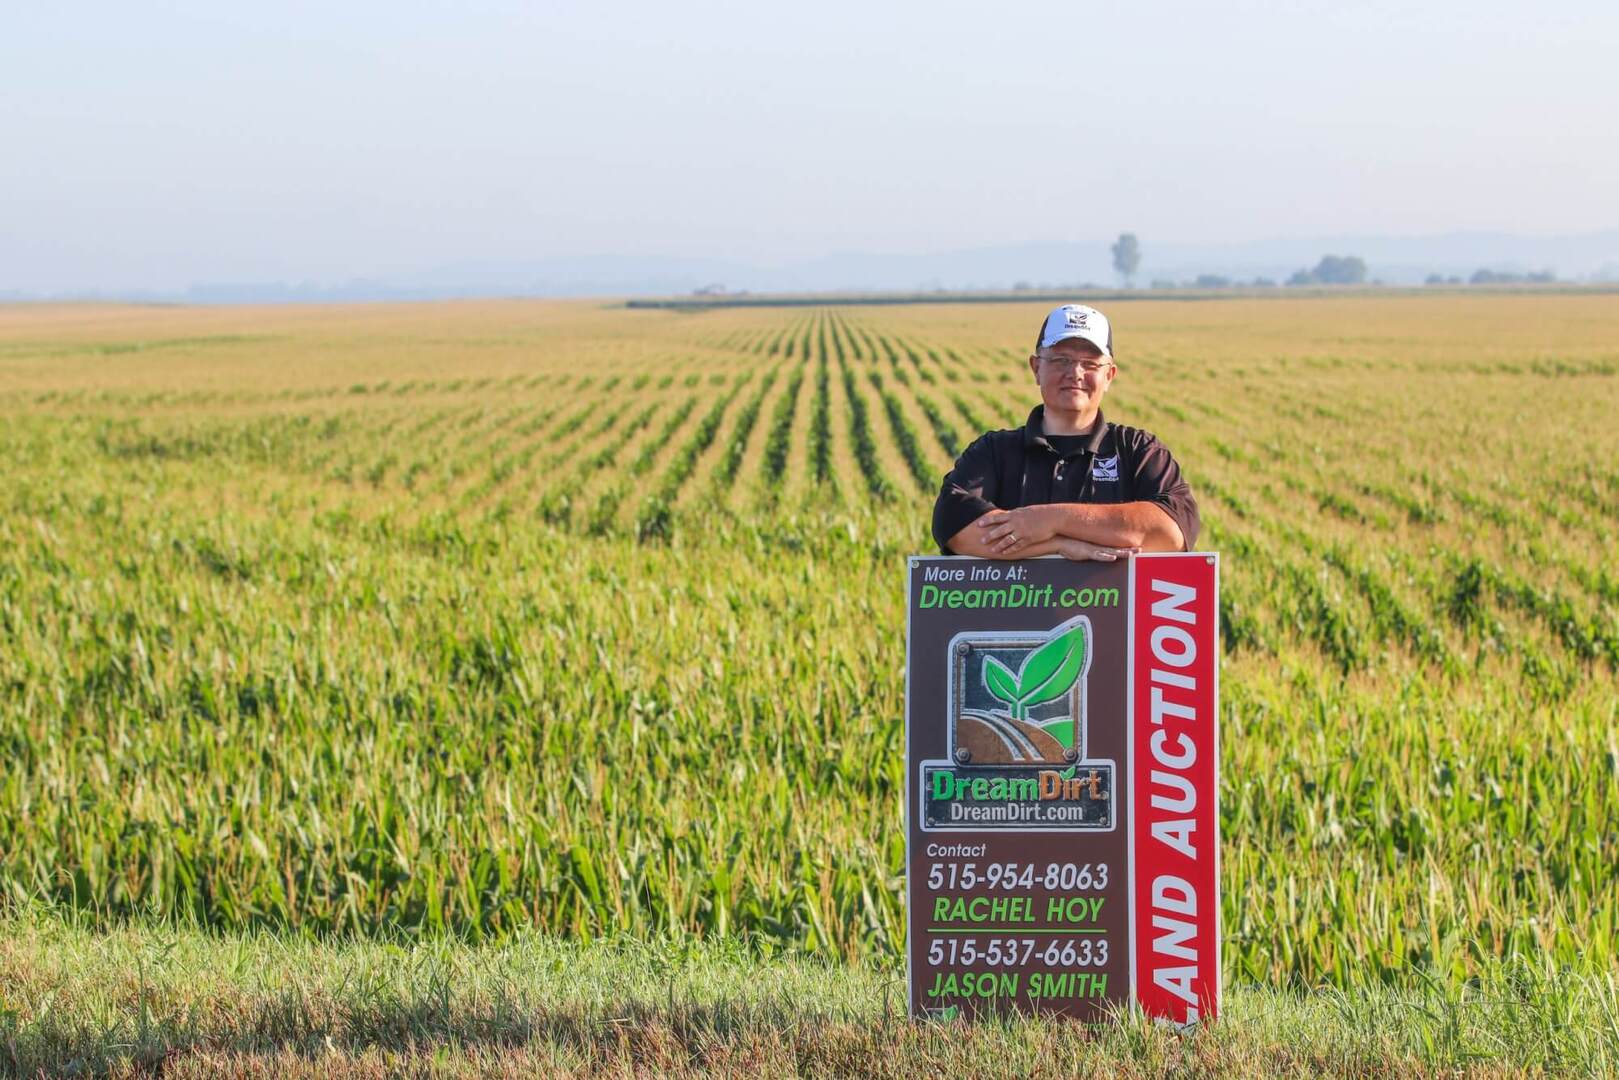
Check out the table below of all the auction results from September Iowa land sales sold by auction. For the month of September, the price per acre average of land in Iowa decreased to $12,134 per acre, compared to August’s per acre average price of $13,257.83. A year ago, the average price per acre was similar at $13,088.87 per acre in August of 2022. Reach out to us for an opinion on what we think your farm is worth if you are considering selling.

Number of Farmland Acres Sold in Iowa During September 2023
If you take a look at the graph to the right you will see an increase in farmland acres sold at auction from August to September. In August, we saw 8,335 acres sold at auction compared to 10,535 acres sold this month. If you are thinking of selling, now is the time to reach out to learn more about the process! Fill out this form to get started today and one of our auctioneers or land brokers will contact you shortly!

Price Per CSR2 Point Iowa Farmland
The price per CSR2 point decreased $5 from August and is currently at $163.73/CSR2 point. A year ago price per CSR2 was $168.87/CSR2 point. This value is used to help calculate what your farm is worth. If you don’t know your farm’s CSR2 soil rating reach out to us for a soil map and evaluation if you are thinking of selling land in Iowa.

Jason J Smith
Auctioneer & Land Broker
Jason is an experienced farmland broker and auctioneer with extensive experience in farmland sales across this Midwest. Jason has worked with hundreds of clients to create advantageous outcomes. If you are selling land schedule a consultation with Jason by calling or using the calendar.
Phone: 515-537-6633
Iowa Farmland Sales Auction Results September 2023
| County | Total Acres | Tillable Acres | Price Per Tillable Acre | CSR2 | $ per Tillable CSR2 | Price | % Tillable | Date |
|---|---|---|---|---|---|---|---|---|
| Audubon | 120 | 112.28 | $17,400.00 | 80.9 | $215.08 | $2,088,000.00 | 93.57 | 9/6/23 |
| Boone | 40 | 39.84 | $12,500.00 | 77.7 | $160.88 | $500,000.00 | 99.60 | 9/6/23 |
| Butler | 80 | 76 | $10,800.00 | 81.4 | $132.68 | $864,000.00 | 95.00 | 9/8/23 |
| Butler | 80 | 76 | $12,300.00 | 85.2 | $144.37 | $984,000.00 | 95.00 | 9/8/23 |
| Calhoun | 115 | 108.64 | $10,700.00 | 82.9 | $129.07 | $1,230,500.00 | 94.47 | 9/7/23 |
| Calhoun | 135 | 134.25 | $15,250.00 | 85.1 | $179.20 | $2,058,750.00 | 99.44 | 9/6/23 |
| Dallas | 132.7 | 88.78 | $11,800.00 | 70.7 | $166.90 | $1,565,860.00 | 66.90 | 9/7/23 |
| Dallas | 157.12 | 146.16 | $17,600.00 | 87.8 | $200.46 | $2,765,312.00 | 93.02 | 9/7/23 |
| Hamilton | 134.35 | 113.46 | $8,188.00 | 81.9 | $99.98 | $1,100,057.80 | 84.45 | 9/5/23 |
| Hancock | 45 | 44.41 | $12,800.00 | 63.8 | $200.63 | $576,000.00 | 98.69 | 9/8/23 |
| Hardin | 96 | 93.36 | $15,100.00 | 90.4 | $167.04 | $1,449,600.00 | 97.25 | 9/8/23 |
| Henry | 228 | 92.97 | $5,800.00 | 66.2 | $87.61 | $1,322,400.00 | 40.78 | 9/6/23 |
| Henry | 62.24 | 52 | $8,085.00 | 61.2 | $132.11 | $503,210.40 | 83.55 | 9/7/23 |
| Henry | 93.01 | 82.11 | $11,786.00 | 80 | $147.33 | $1,096,215.86 | 88.28 | 9/7/23 |
| Henry | 75.61 | 73.50 | $11,786.00 | 80 | $147.33 | $891,139.46 | 97.21 | 9/7/23 |
| Jasper | 74.97 | 70.91 | $13,200.00 | 75 | $176.00 | $989,604.00 | 94.58 | 9/7/23 |
| Jasper | 39.22 | 39.22 | $11,950.00 | 66 | $181.06 | $468,679.00 | 100.00 | 9/7/23 |
| Kossuth | 159 | 155 | $11,750.00 | 78 | $150.64 | $1,868,250.00 | 97.48 | 9/7/23 |
| Marshall | 80 | 77.64 | $14,400.00 | 77.2 | $186.53 | $1,152,000.00 | 97.05 | 9/8/23 |
| Marshall | 80 | 78.39 | $15,800.00 | 85.3 | $185.23 | $1,264,000.00 | 97.99 | 9/8/23 |
| Marshall | 153.24 | 152.68 | $16,700.00 | 91.5 | $182.51 | $2,559,108.00 | 99.63 | 9/6/23 |
| Mitchell | 156.65 | 118.20 | $9,050.00 | 84.4 | $107.23 | $1,417,682.50 | 75.45 | 9/5/23 |
| Monroe | 171.27 | 104.20 | $5,644.00 | 45 | $125.42 | $966,647.88 | 60.84 | 9/5/23 |
| Monroe | 119 | 92.98 | $8,216.00 | 45 | $182.58 | $977,704.00 | 78.13 | 9/5/23 |
| Polk | 134.02 | 125.03 | $11,700.00 | 77.7 | $150.58 | $1,568,034.00 | 93.29 | 9/7/23 |
| Polk | 33.8 | 32.08 | $5,600.00 | 54.3 | $103.13 | $189,280.00 | 94.91 | 9/7/23 |
| Polk | 34.47 | 33.17 | $8,600.00 | 78.4 | $109.69 | $296,442.00 | 96.23 | 9/7/23 |
| Sioux | 143.87 | 143.87 | $20,450.00 | 91.7 | $223.01 | $2,942,141.50 | 100.00 | 9/7/23 |
| Story | 37.15 | 35.81 | $17,000.00 | 88.5 | $192.09 | $631,550.00 | 96.39 | 9/7/23 |
| Tama | 78 | 73.97 | $11,800.00 | 70.7 | $166.90 | $920,400.00 | 94.83 | 9/7/23 |
| Webster | 156 | 156 | $17,000.00 | 85.2 | $199.53 | $2,652,000.00 | 100.00 | 9/8/23 |
| Benton | 97.67 | 96.67 | $20,900.00 | 95.6 | $218.62 | $2,041,303.00 | 98.98 | 9/12/23 |
| Benton | 65.05 | 61 | $16,500.00 | 91.5 | $180.33 | $1,073,325.00 | 93.77 | 9/12/23 |
| Benton | 71 | 69 | $7,825.00 | 57.3 | $136.56 | $555,575.00 | 97.18 | 9/13/23 |
| Benton | 77 | 38 | $7,275.00 | 65.9 | $110.39 | $560,175.00 | 49.35 | 9/13/23 |
| Boone | 80 | 79.1 | $16,600.00 | 85.5 | $194.15 | $232,352.00 | 98.88 | 9/8/23 |
| Chickasaw | 79 | 77.65 | $14,140.00 | 82.6 | $171.19 | $1,117,060.00 | 98.29 | 9/13/23 |
| Chickasaw | 303.8 | 222.62 | $8,131.00 | 63.7 | $127.65 | $2,470,197.80 | 73.28 | 9/13/23 |
| Chickasaw | 70.72 | 44 | $8,181.00 | 36.3 | $225.37 | $578,560.32 | 62.22 | 9/13/23 |
| Davis | 28.04 | 0 | $7,700.00 | 42 | $183.33 | $215,908.00 | 0.00 | 9/12/23 |
| Davis | 33.56 | 30 | $8,900.00 | 43 | $206.98 | $298,684.00 | 89.39 | 9/12/23 |
| Fayette | 80 | 72.34 | $17,600.00 | 89.4 | $196.87 | $640,500.00 | 90.43 | 9/12/23 |
| Howard | 240 | 232.60 | $14,900.00 | 84.2 | $176.96 | $3,576,000.00 | 96.92 | 9/13/23 |
| Humboldt | 118 | 116 | $13,200.00 | 63.4 | $208.20 | $1,557,600.00 | 98.31 | 9/15/23 |
| Ida | 155.34 | 146.36 | $8,825.00 | 57.5 | $153.48 | $1,370,875.50 | 94.22 | 9/12/23 |
| Jasper | 147.8 | 141.10 | $9,150.00 | 54.4 | $168.20 | $1,352,370.00 | 95.47 | 9/14/23 |
| Jasper | 138.83 | 138.83 | $8,100.00 | 52.2 | $155.17 | $1,124,523.00 | 100.00 | 9/14/23 |
| Jefferson | 189.28 | 156.77 | $5,900.00 | 64.3 | $91.76 | $1,116,752.00 | 82.82 | 9/14/23 |
| Jones | 31.5 | 23.62 | $16,100.00 | 57.2 | $281.47 | $507,150.00 | 74.98 | 9/15/23 |
| Jones | 319.5 | 276.96 | $10,000.00 | 48.5 | $206.19 | $3,195,000.00 | 86.69 | 9/15/23 |
| Jones | 14.57 | 11.85 | $13,200.00 | 63.4 | $208.20 | $192,324.00 | 81.33 | 9/15/23 |
| Kossuth | 87 | 83.90 | $16,200.00 | 83.1 | $194.95 | $1,409,400.00 | 96.44 | 9/12/23 |
| Kossuth | 40 | 38.30 | $16,500.00 | 85.9 | $192.08 | $2,559,920.00 | 95.75 | 9/12/23 |
| Madison | 160 | 105.21 | $8,100.00 | 72.6 | $111.57 | $1,296,000.00 | 65.76 | 9/15/23 |
| Madison | 184 | 78.66 | $7,100.00 | 58.3 | $121.78 | $1,306,400.00 | 42.75 | 9/15/23 |
| Madison | 120 | 11.84 | $6,100.00 | 69 | $88.41 | $732,000.00 | 9.87 | 9/15/23 |
| Mahaska | 160 | 152 | $18,000.00 | 74 | $243.24 | $870,900.00 | 95.00 | 9/9/23 |
| Monona | 76.14 | 66.87 | $11,800.00 | 60.7 | $194.40 | $898,452.00 | 87.83 | 9/9/23 |
| Union | 153 | 107 | $6,500.00 | 55.3 | $117.54 | $994,500.00 | 69.93 | 9/9/23 |
| Wapello | 130 | 124.81 | $5,750.00 | 48.2 | $119.29 | $747,500.00 | 96.01 | 9/14/23 |
| Wapello | 107 | 101.63 | $5,200.00 | 37.1 | $140.16 | $556,400.00 | 94.98 | 9/14/23 |
| Winnebago | 95.02 | 87.97 | $12,500.00 | 78.6 | $159.03 | $1,187,750.00 | 92.58 | 9/12/23 |
| Wright | 153 | 146.63 | $10,100.00 | 63.5 | $159.06 | $1,545,300.00 | 95.84 | 9/15/23 |
| Adams | 40 | 36.97 | $15,500.00 | 82.8 | $187.20 | $620,000.00 | 92.43 | 9/21/23 |
| Adams | 40 | 30.90 | $11,500.00 | 70.5 | $163.12 | $460,000.00 | 77.25 | 9/21/23 |
| Black Hawk | 118.1 | 106.82 | $15,900.00 | 87.5 | $181.71 | $1,877,790.00 | 90.45 | 9/19/23 |
| Greene | 60 | 55.57 | $15,900.00 | 86.5 | $183.82 | $954,000.00 | 92.62 | 9/22/23 |
| Guthrie | 147.16 | 55 | $8,700.00 | 60.5 | $143.80 | $1,280,292.00 | 37.37 | 9/20/23 |
| Jasper | 164.06 | 107.15 | $8,800.00 | 58.8 | $149.66 | $1,443,728.00 | 65.31 | 9/21/23 |
| Jasper | 114.05 | 111.87 | $13,200.00 | 81.7 | $161.57 | $1,505,460.00 | 98.09 | 9/21/23 |
| Jasper | 26.54 | 25.89 | $11,502.00 | 80.4 | $143.06 | $305,263.08 | 97.55 | 9/21/23 |
| Jasper | 172.71 | 125.59 | $10,566.00 | 81.5 | $129.64 | $1,824,853.86 | 72.72 | 9/21/23 |
| Jasper | 137.06 | 123.88 | $8,000.00 | 68.8 | $116.28 | $1,096,480.00 | 90.38 | 9/21/23 |
| Jefferson | 200 | 160.78 | $6,850.00 | 68 | $100.74 | $1,370,000.00 | 80.39 | 9/21/23 |
| Jefferson | 40 | 30.99 | $11,700.00 | 83.2 | $140.63 | $468,000.00 | 77.48 | 9/21/23 |
| Kossuth | 78.79 | 78.79 | $15,100.00 | 85.7 | $176.20 | $1,189,729.00 | 100.00 | 9/19/23 |
| Kossuth | 71 | 71 | $17,200.00 | 85.2 | $201.88 | $1,221,200.00 | 100.00 | 9/19/23 |
| Palo Alto | 230.81 | 226.30 | $17,500.00 | 85.5 | $204.68 | $4,039,175.00 | 98.05 | 9/21/23 |
| Palo Alto | 79 | 76.04 | $16,500.00 | 88.1 | $187.29 | $1,303,500.00 | 96.25 | 9/21/23 |
| Pocahontas | 145.9 | 120.95 | $7,350.00 | 64.9 | $113.25 | $1,072,365.00 | 82.90 | 9/22/23 |
| Sac | 120 | 119.06 | $14,200.00 | 90.8 | $156.39 | $1,704,000.00 | 99.22 | 9/19/23 |
| Sac | 80 | 77.35 | $13,900.00 | 89.9 | $154.62 | $1,112,000.00 | 96.69 | 9/19/23 |
| Sac | 60 | 56.63 | $11,500.00 | 88.3 | $130.24 | $690,000.00 | 94.38 | 9/19/23 |
| Taylor | 120 | 114.14 | $9,100.00 | 55.8 | $163.08 | $1,092,000.00 | 95.12 | 9/21/23 |
| Winnebago | 77 | 75.06 | $15,800.00 | 85.2 | $185.45 | $1,216,600.00 | 97.48 | 9/20/23 |
| Wright | 156.11 | 153.06 | $11,200.00 | 77.2 | $145.08 | $1,748,432.00 | 98.05 | 9/19/23 |
| Sioux | 90.61 | 79.97 | $10,900.00 | 53.7 | $202.98 | $987,649.00 | 88.26 | 9/23/23 |
| Boone | 160 | 152.47 | $9,350.00 | 72.3 | $129.32 | $1,496,000.00 | 95.29 | 9/26/23 |
| Buena Vista | 119 | 115.80 | $13,300.00 | 84.9 | $156.65 | $1,582,700.00 | 97.31 | 9/26/23 |
| Fayette | 77 | 74.37 | $15,500.00 | 89.4 | $173.38 | $1,193,500.00 | 96.58 | 9/26/23 |
| Fayette | 36.98 | 33.42 | $13,000.00 | 88.9 | $146.23 | $480,740.00 | 90.37 | 9/26/23 |
| Wapello | 39.91 | 14 | $4,200.00 | 52 | $80.77 | $167,622.00 | 35.08 | 9/28/23 |
| O’Brien | 47.29 | 45.84 | $19,500.00 | 96.2 | $202.70 | $922,155.00 | 96.93 | 9/28/23 |
| Grundy | 148.51 | 148.51 | $21,600.00 | 92.2 | $234.27 | $3,207,816.00 | 100.00 | 9/28/23 |
| Buchanan | 210.84 | 210.88 | $16,700.00 | 78 | $214.10 | $3,521,028.00 | 100.02 | 9/28/23 |
| Franklin | 77 | 74.79 | $15,700.00 | 85.9 | $182.77 | $1,208,900.00 | 97.13 | 9/29/23 |
| STATEWIDE TOTALS | 10535.94 | 9,052.04 | $12,134.90 | 73.48 | $163.73 | $122,102,302.96 | 85.92 |
Jason Smith, Broker | Auctioneer
Founder, Farmland Auctioneer & Land Broker
Jason is an experienced farmland broker and auctioneer with extensive experience in farmland sales across this Midwest. Jason has worked with hundreds of clients to create advantageous outcomes. If you are selling land schedule a consultation with Jason by calling or using the calendar.
Email: [email protected] | Phone: 515-537-6633

Iowa Land Prices at A Glance
For people who wish to visualize and research Iowa farmland prices, our heat maps have been a huge help. Here you can research your farm’s proximity or the statewide market and see individual sale results. This includes average prices per acre, the average price per CSR2 point, as well as volumes of sales, and the number of acres sold. Use this market price research tool right here at DreamDirt. Click the Iowa map to get started.
Request a Free Valuation for Your Farm or Land Property
You can request a FREE Market Analysis whether you’re ready to sell or just curious! Our goal is to help you reach the top of the market when selling land in the Midwest.
Unlocking the Value of Iowa Farmland: A Comprehensive Guide to Current Land Prices and Expert Insights – March 2024 Report
Welcome to Our Monthly Iowa Farmland Value Report In this monthly report, we dive into Iowa farmland values, helping you understand the factors that determine what your farm is potentially worth. Our goal as auctioneers and farmland real estate agents is to provide...

Insights from the REALTORS® Land Institute: Understanding Iowa’s Farmland Market Trends
Iowa Land Price Trends At DreamDirt Auctions, we're committed to keeping our audience of landowners informed about the latest developments in the agricultural real estate market. Today, we're excited to share insights from the REALTORS® Land Institute - Iowa Chapter's...
Unlocking the Value of Nebraska Farmland: A Comprehensive Guide to Current Land Prices and Expert Insights – February 2024 Report
Welcome to Our Monthly Nebraska Farmland Value Report In this monthly report, Jason Smith, Nebraska Land Broker and Auctioneer dives into Nebraska farmland values, helping you understand the factors that determine what your farm is potentially worth. Our goal as...